How to Read Practice Test Score Reports (and Actually Use Them)
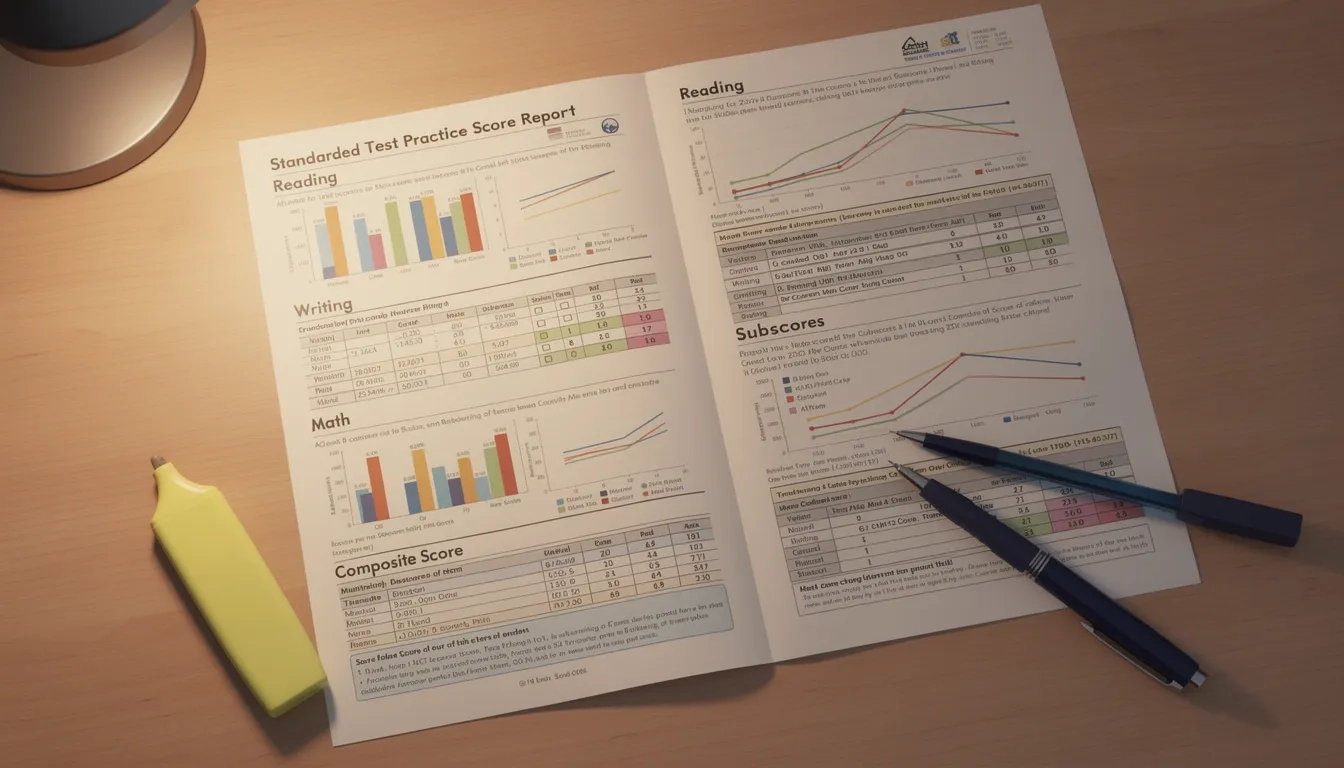
Most students flip to their practice test score report, glance at the total number, feel some version of "good" or "terrible," and close the tab. That ritual takes about 90 seconds and throws away most of the value. The composite score is nearly the least useful number on the page. The real signal lives two or three layers deeper — in subscores, error categories, timing patterns, and percentile comparisons that most students never touch. Once you know how to read these reports properly, a single practice test becomes worth more than three tests analyzed at surface level.
What's Actually in a Score Report
A score report isn't a report card. Think of it like a blood panel: the headline number tells you roughly how you're doing, but the individual markers tell you why and what to fix.
SAT score reports from College Board include several distinct layers. Your composite (400–1600) is the sum of two section scores: Math (200–800) and Evidence-Based Reading and Writing (200–800). Beneath those, you get seven subscores on a 1–15 scale covering skills like Command of Evidence, Heart of Algebra, and Passport to Advanced Math. There are also two cross-test scores (10–40 scale) for Analysis in Science and Analysis in History/Social Studies.
ACT score reports work differently. Your composite (1–36) is the average of four section scores — English, Math, Reading, and Science — and each section breaks into reporting categories. English splits into Production of Writing, Knowledge of Language, and Conventions of Standard English. That specificity matters, because "I'm bad at English" is not a study plan, but "I'm losing points on Knowledge of Language" is.
Here's how the two reports compare at a glance:
| Report Element | SAT | ACT |
|---|---|---|
| Composite range | 400–1600 | 1–36 |
| Section scores | 2 (Math, EBRW) | 4 (Eng, Math, Reading, Sci) |
| Subscores/reporting categories | 7 subscores (1–15) | 3–4 per section |
| Percentile types | National, user group, state, country | National |
| Cross-test scores | 2 (Science, History) | None |
The cross-test scores are genuinely underrated. They measure whether you can apply analytical thinking across different subject contexts. A low Analysis in Science cross-test score on the SAT often predicts struggles on the ACT Science section too — they're measuring the same underlying skill through different content.
Raw vs. Scaled Scores: The Number Behind the Number
This is where most students get confused. Raw scores count correct answers; scaled scores adjust for the specific difficulty of that test form through a process College Board calls "linking."
Why does this matter? Because if you took a harder practice test version, you might answer 42 questions correctly and score a 680. On an easier form, you might answer 46 correctly and still score 680. The equating process makes scores comparable across test dates regardless of form difficulty.
The practical takeaway: don't obsess over raw counts across multiple sessions. A student who sees their scaled Math score move from 590 to 620 to 645 over three practice tests is making real, measurable progress — even if the number of wrong answers fluctuates.
"The scaled score is the only fair comparison between test forms. Raw correct-answer counts mean something within a single test; across different forms, they're noise."
Percentiles: The Score That Matters for Admissions
A 1300 on the SAT sounds decent. But is it? Context changes everything.
College Board now reports four different percentile types: nationally representative (all U.S. 12th graders, weighted), user group (people who actually took the test that year), state, and country. These can diverge noticeably. The nationally representative percentile tends to run higher because it includes students who never sit for the SAT, pulling the baseline down.
For college admissions, user group percentiles are what matter. That's your competition. If you're targeting schools where the middle 50% of admitted students scored between 1380 and 1520, and your user group percentile puts you at the 72nd percentile (roughly 1310–1320), you're below that window and need to know it before making application decisions.
Here's something most prep guides won't tell you: moving from the 70th to 80th percentile requires a larger point jump than moving from the 50th to 60th percentile. The SAT's score distribution compresses near the top. Students scoring above 1350 should expect each incremental 30-point gain to take meaningfully more work than the last. Plan accordingly.
Subscores: Where the Real Diagnostic Value Lives
This is the section most students skip entirely. That's a mistake.
SAT subscores on a 1–15 scale cover specific skill areas: Command of Evidence, Words in Context, Expression of Ideas, Standard English Conventions, Heart of Algebra, Problem Solving and Data Analysis, and Passport to Advanced Math. If your total Math score is 620 but your Heart of Algebra subscore is 9 out of 15 while your Problem Solving score is 14 out of 15, you don't need more general math practice. You need algebra practice. Specifically.
The Compass Prep platform takes this further by tracking "attractor answers" — the wrong answers that consistently fool a given student. If you keep selecting the same category of trap answer across multiple tests, that's a pattern. Patterns are fixable; random errors are not. Their time analysis also shows whether you spend 4+ minutes on algebra problems while breezing through data questions, which tells you exactly where your processing breaks down under pressure.
A practical framework for subscore analysis:
- Flag any subscore below the 60th percentile within that section
- Rank those weak subscores by point-volume impact (a weak subscore covering 20% of questions costs more than one covering 8%)
- Target the top two weak subscores for the next two weeks of focused study
Don't try to fix everything at once. Students who go deep on two weak subscores consistently outperform students who spread effort thin across five.
Not All Wrong Answers Are the Same
Here's the most important mindset shift in all of test prep. Wrong answers have different causes, and treating them identically wastes study time.
Sort every missed question into one of four categories:
- Content knowledge gaps: You genuinely don't understand the concept. Quadratic formula, subject-verb agreement with compound modifiers, stoichiometry. These require rebuilding from scratch — not just drilling more practice problems on the same material you've been misusing.
- Careless errors: You know the concept but misread the question, rushed the arithmetic, or chose the answer you wanted to see. Would unlimited time have fixed it? If yes, it's a careless error — and the fix is pacing strategy, not content review.
- Process failures: You understand the goal but execute wrong steps. You solved for x when the question asked for 2x. You found the main idea but chose a true statement that wasn't the most supported main idea. These require drill on applying concepts correctly, not re-learning them.
- Time pressure mistakes: You ran out of time and guessed blind. The ACT national average sat at 19.4 in 2024, and time management accounts for a large share of why students plateau in the 18–22 range.
The Blind Review Method is the best tool for separating these categories. After finishing a timed practice test, go back through every question you flagged or guessed on — without looking at the answer key yet. Solve them again without the clock running. If you get them right in review but wrong under timed conditions, that's a time pressure or careless error problem, not a content gap. The fix changes entirely based on which bucket the mistake falls into.
Turning Your Score Report Into a Study Plan
Reading the report is step one. Doing something with it is where most students stall.
Tracking across three or more practice tests reveals whether preparation is actually working. One data point is noise. Three data points form a trend. If a student's Heart of Algebra subscore stays at 9 across three consecutive practice tests despite weekly study sessions, something about the approach isn't working — not the effort, but the method.
A realistic improvement benchmark: students doing structured prep for 12–16 weeks typically gain somewhere between 60 and 120 SAT points. Above 1400, the same effort yields smaller absolute gains. Below 1100, well-targeted content work can move the needle fast. Don't let score report data trigger panic — let it set direction.
Here's a weekly review rhythm that actually works:
- Saturday: Full practice test under strict timed conditions
- Sunday: Blind review of all flagged and missed questions before checking the answer key
- Monday: Pull the score report; categorize every missed question as content gap, careless error, process failure, or time pressure
- Tuesday–Friday: Focused content review on your top two weak subscores, plus 20 minutes of timed targeted drills
The elephant in the room with score reports is that students use them for judgment when they should be using them for navigation. A low subscore isn't a verdict about ability. It's a signpost pointing at where to study next.
Common Mistakes When Reading Score Reports
Even diligent students fall into predictable traps.
Chasing the composite score while ignoring subscores is the most common one. You cannot improve a 620 Math score without knowing whether it's algebra, data analysis, or geometry dragging the number down. The composite is the result; subscores are the cause.
Ignoring timing data is the second big error. Compass Prep and similar platforms show time-per-question breakdowns; College Board's Bluebook app tracks pacing on digital SAT practice tests. If you're spending an average of 2 minutes and 47 seconds per math question when the test allocates roughly 1 minute and 35 seconds, you already know your biggest problem — and it's not content knowledge.
Treating practice scores as predictions rather than diagnostics is a subtler trap. Practice tests taken at home tend to run 20–50 SAT points higher than official test day scores, partly because home conditions lack the fatigue, noise, and real stakes of actual test day. Use practice score trends to gauge your trajectory; don't treat any single practice result as a firm ceiling or floor.
Bottom Line
- Start with subscores, not the composite. The total score shows the outcome; subscores show the cause — and the cause is what you can actually change.
- Categorize every mistake into content gap, careless error, process failure, or time pressure. The fix is completely different for each.
- Use the Blind Review Method after every practice test to separate what you don't know from what you just couldn't do fast enough.
- Track three or more practice tests before drawing conclusions. One result is an anecdote; a trend across multiple sessions is actually actionable.
- Navigate by the report, don't be judged by it. A weak subscore isn't a statement about your potential. It's a map showing you where to go next.
Frequently Asked Questions
What's the difference between subscores and section scores on the SAT?
Section scores (200–800) represent overall performance in Math and Reading/Writing. Subscores (1–15) break those sections into specific skill areas like Heart of Algebra or Command of Evidence. Section scores tell you how much you missed; subscores tell you what you missed — which is the more actionable of the two numbers.
How many practice tests should I take before my real test date?
Five full-length tests is a reasonable minimum for most standardized exams. You need enough data points to tell real weaknesses apart from one-off bad days. College Board's Bluebook app and Khan Academy each offer eight free digital SAT practice tests, and all should be taken under strict timed conditions to make the data meaningful.
My score isn't improving even though I'm studying hard. What's likely wrong?
The most common culprit is misreading the score report — studying content you already know while overlooking the subscores that flag your actual gaps. Do a thorough error categorization on your last two practice tests. If mistakes cluster in "process failures" (right concept, wrong execution), more concept review won't help. What you need is deliberate practice applying concepts under timed, test-like conditions.
Is a high practice score a reliable predictor of real test performance?
Roughly, but not precisely. Practice tests taken at home tend to run high compared to official scores — often by 20–50 SAT points — because of different environmental conditions and lower stakes. Use practice score trends to gauge your trajectory rather than treating any single score as a firm prediction of what you'll see on test day.
Does it matter which practice tests I use for score analysis?
Yes, meaningfully. Official practice tests released by College Board and ACT are calibrated to the actual exam's difficulty and scoring curves. Third-party tests from tutoring companies vary widely in accuracy. For reliable subscore and percentile data, stick to official materials. Third-party tests are fine for extra reps, but don't make study plan decisions based on their score reports alone.
Sources
- Practice Tests Results and Score Reports: ACT, AP, PSAT, SAT — Compass Prep
- How to Analyze Practice Test Scores Before Your Retake — CrucialExams
- Understanding Score Reports and Using Them to Improve Performance — The Smart Push
- How to Read Your SAT Score Report (2025-26 Guide) — UWorld College Prep
- Understanding Your ACT Scores — ACT.org