How Concordance Tables Work: SAT to ACT Score Conversion
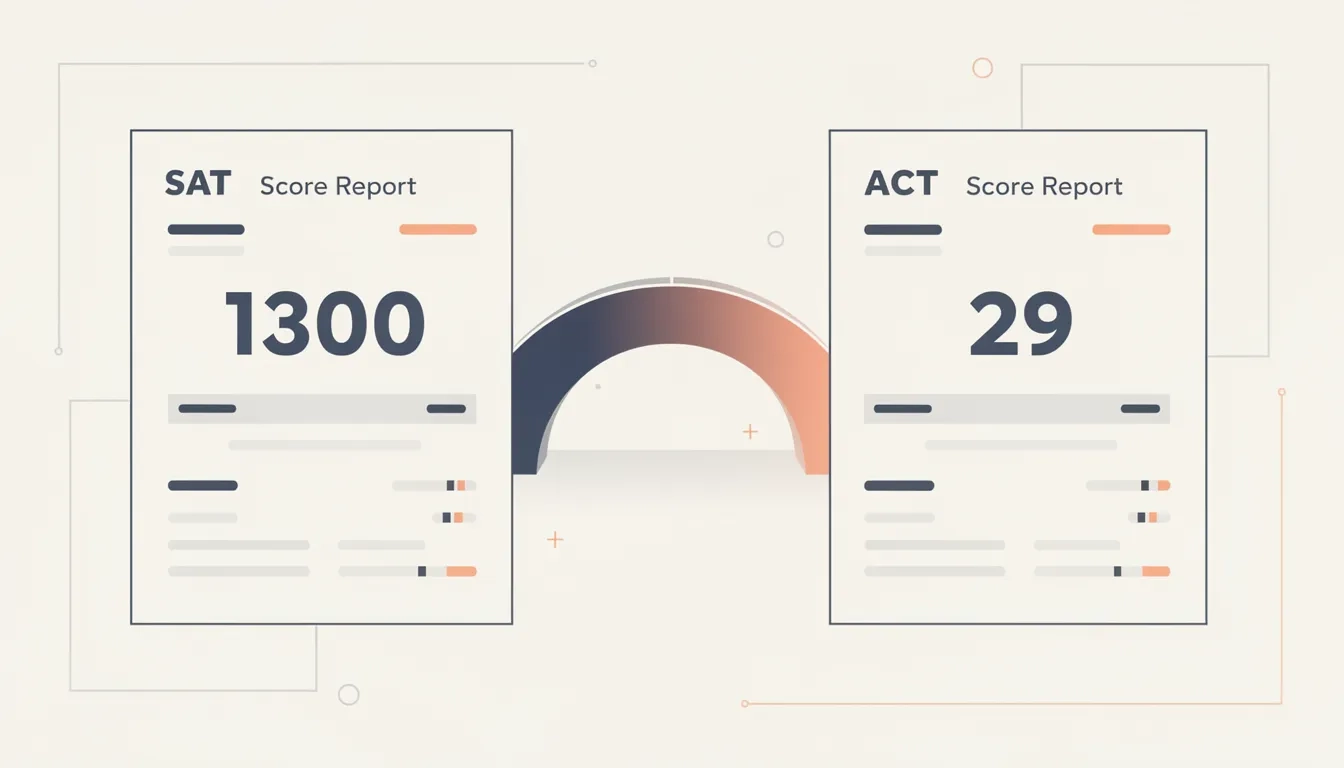
Somewhere in 2018, ACT, Inc. and the College Board pulled the score records of roughly 600,000 students from the graduating class of 2017. These were students who had done something uncommon: they sat for both the SAT and the ACT within a reasonably close window of time. Researchers cross-referenced the results, mapped the percentile distributions, and published what became the definitive concordance tables used today by admissions offices, scholarship programs, and the NCAA. Most students who punch their SAT score into a concordance calculator have never stopped to ask what's actually inside it, or how much uncertainty comes with the output.
What Concordance Actually Means
The first thing to understand is what concordance is not. It is not a unit converter. You can't plug in a 1300 SAT and receive a mathematically equivalent ACT score the way you'd convert 60 mph to 96 km/h. The math doesn't work like that because the two tests aren't measuring the exact same thing in the exact same way.
What concordance does is both simpler and messier. It tells you: students who scored X on the SAT tended to score Y on the ACT. That's a statistical observation built from population data, not a rule of physics.
ACT, Inc. spells this out directly: concordance tables "do not equate scores, but rather provide a tool for finding comparable scores." Equating would require both tests to be parallel forms of the same assessment. They're not. The SAT runs 400–1600. The ACT runs 1–36. Their timing, question formats, and section weights differ enough that direct mathematical conversion is off the table.
Percentile rank is the actual bridge between the two scores. If your SAT result puts you at the 93rd percentile of test-takers, and an ACT score of 30 also falls at the 93rd percentile, then 30 is your concorded equivalent. Two students at the same point in the performance distribution are treated as comparable, even when the raw numbers look nothing alike.
This framing has real consequences. A student who happens to match the ACT's format and pacing might genuinely outscore what their concorded SAT number predicts. The table gives you an approximation. It does not give you a fact.
How the 2018 Tables Were Built
The tables in use today replaced a set from 2006 that relied on indirect conversions from the old pre-2016 SAT format. That earlier method was clunky. Each intermediate conversion step introduced extra noise, like translating a legal contract through two intermediaries instead of working from the original document.
The 2018 study cut out the middle steps. ACT, Inc. and the College Board, working alongside the NCAA Technical Advisory Board, gathered records from approximately 600,000 graduates who had taken both tests in a comparable period. No lab conditions, no artificial sample construction — real students, real scores, matched across two assessments.
Researchers identified where each test's percentile distributions aligned, then paired the ACT score at the 80th percentile with the SAT score at the 80th percentile — and repeated that process across the full scoring range.
When the new tables published, they revealed some telling shifts from the previous versions:
- High scores (SAT 1270–1600) concorded to slightly higher ACT values. An SAT 1500 previously mapped to ACT 33; under the 2018 tables, it maps to ACT 34.
- Low scores in the 590–920 SAT range shifted to slightly lower ACT equivalents.
- The middle of the distribution stayed relatively stable.
These weren't dramatic changes, but they mattered for students sitting right at scholarship cutoffs. Both organizations agreed to treat the 2018 tables as the single official standard going forward, replacing any prior versions.
The Numbers: What Scores Map to What
Here's a reference snapshot from the official 2018 concordance tables, showing where key composite scores land across both tests:
| ACT Composite | SAT Total | Approximate Percentile |
|---|---|---|
| 36 | 1590–1600 | 99th+ |
| 34 | 1520–1540 | 99th |
| 32 | 1450–1470 | 95th |
| 30 | 1390–1410 | 93rd |
| 28 | 1310–1330 | 88th |
| 26 | 1230–1250 | 82nd |
| 24 | 1150–1170 | 73rd |
| 22 | 1060–1080 | 63rd |
| 20 | 980–1010 | 52nd |
| 19 | 960–980 | 50th |
| 16 | 840–860 | 34th |
Section-level concordance also exists, though it's less clean than composite comparisons. The SAT splits into Evidence-Based Reading and Writing (200–800) and Math (200–800). The ACT has four sections, each scored 1–36: English, Math, Reading, and Science.
For math, ACT Math maps fairly directly to SAT Math. For verbal, researchers summed ACT English and Reading (producing a combined range of 14–72) and compared that combined score against SAT's Evidence-Based Reading and Writing section. Useful, but less precise.
Science has no SAT counterpart at all. That's a structural gap between the two tests that no concordance can bridge.
The Hidden Margin of Error
This is the part that most conversion calculators quietly skip. The 2018 concordance study reports a standard error of approximately ±2.26 ACT composite points. On the SAT side, the corresponding figure is ±79.57 points.
In practice: if a student scores 1300 on the SAT, the concorded ACT isn't a crisp 28. It's a range, roughly 26–30. Four ACT points of uncertainty is baked into every conversion at that score level.
For most applications — scholarship thresholds, college median ranges, athletic eligibility — this matters. A student who concordes to a 27 from their SAT could realistically score anywhere from 25 to 29 on an actual ACT sitting. Treating the concorded number as a precise data point is moving the goalposts without realizing it.
Section-level conversions carry even more error than composite ones. The composite benefits from averaging multiple subscores, which smooths out random variation. Individual section scores reflect narrower performance windows, and the error bands widen accordingly.
This isn't a flaw in the research. It's an honest acknowledgment (one the researchers deserve credit for stating plainly in the methodology) that two independently built tests can only approximate each other. The tables tell you where to look, not exactly where you'll land.
How Colleges, Scholarships, and the NCAA Use These Tables
Most selective colleges treat concorded scores as functionally interchangeable. A student submitting an ACT 33 and a student submitting an SAT 1500 are handled comparably in admissions review because their concorded percentiles are nearly identical.
The NCAA Eligibility Center uses the official concordance tables to enforce academic minimums for student athletes. Division I and II recruits must meet sliding-scale thresholds that pair test scores with GPA. The center converts submitted scores through the concordance tables so students with either result are evaluated on the same standard. A combined SAT of 1000 (concorded to roughly ACT 19) requires a higher GPA than a combined SAT of 1080 under the NCAA's sliding scales.
Scholarship programs use concordance thresholds similarly. Georgia's HOPE Scholarship publishes concorded score floors so students can qualify regardless of which test they took. Many state merit programs work the same way. The National Merit Scholarship Corporation operates differently (its Preliminary SAT Selection Index is SAT-based and has no ACT equivalent), but most state-level merit programs rely on concordance for equal treatment.
When submitting scores to colleges, you don't convert anything yourself. Admissions offices run the concordance on their end. Your only job is to submit your actual scores from whichever test you took.
One practical note on superscoring: colleges that superscore take your best section scores across multiple sittings. Concordance tables apply to single-sitting composites, not superscored results. A superscored SAT 1400 assembled from two test dates doesn't necessarily concord to the same ACT range as a single-sitting 1400.
The Digital SAT and Enhanced ACT: Does the Old Table Still Hold?
The SAT went digital in spring 2024. The ACT launched its Enhanced version in April 2025, making Science optional and changing the composite to the average of three sections (English, Math, Reading) instead of four.
For the digital SAT, the 2018 tables remain valid. College Board confirmed that digital and paper SAT scores are directly comparable because the scale, scoring population, and tested content are consistent. The delivery format changed; the score meaning didn't.
The Enhanced ACT is a different story. Under the prior format, the composite averaged four sections. A student weak in Science had that subscore pull their composite down. Under the Enhanced version, that same student may score meaningfully higher just by testing in an environment where Science is excluded from the composite calculation.
No updated concordance tables have been released for the Enhanced ACT. Both organizations maintain that the 2018 tables are still the official standard. But the methodology behind those tables assumed four-section composites, and that assumption no longer holds for Enhanced ACT takers.
My read: treat the current tables as a rough guide for Enhanced ACT composites, but expect more error than the official ±2.26 figure suggests — especially for students who were historically strong or weak in Science. The field will need a new joint study once enough Enhanced ACT data accumulates. Until that research publishes, we're working with an imperfect fit.
Bottom Line
- Concordance is percentile-based, not mathematically derived. An SAT 1400 and an ACT 30 are "equivalent" because they sit at similar points in the score distribution, not because they measure identical things.
- Every concorded score carries roughly ±2–3 ACT points of uncertainty, or ±80 SAT points. Use it as a range, not a precise figure — especially when evaluating scholarship cutoffs or college median ranges.
- The 2018 tables are still official for the digital SAT. For Enhanced ACT composites (April 2025 onward), expect slightly wider error until updated research is released.
- You don't convert scores yourself. Submit your actual test results; colleges and the NCAA handle the conversion on their end.
- If you're deciding which test to take, concordance tables are a useful benchmark. But taking a full-length practice test of each format is what actually tells you which one suits your strengths.
Frequently Asked Questions
Is a concorded SAT score the same as actually taking the ACT and scoring that number?
No, and this confusion is common. A concorded score shows the ACT range where students at your SAT percentile tend to land — it's a population average, not a personal prediction. Students who naturally fit the ACT's faster pacing and four-section format often outperform their concorded estimate by 2–3 points.
How do I use a concordance table to decide which test to take?
Find where your current practice score sits in the table and compare it against your target schools' published middle 50% ranges. If your concorded equivalent puts you comfortably inside that range, either test will serve you equally. If you're right on the borderline, take a full-length practice test of both formats and compare your actual results before committing to one.
Do the concordance tables apply to my individual section scores, not just my composite?
They do, but with more uncertainty than composite conversions. ACT Math maps to SAT Math, and combined ACT English + Reading maps to SAT Evidence-Based Reading and Writing. ACT Science has no SAT equivalent at all. Section-level tables are helpful for rough comparisons but carry wider error margins than composite concordance.
Is it a myth that some colleges prefer SAT over ACT?
Mostly yes, at least for schools that explicitly accept both. Both tests are covered under the same concordance framework, and selective colleges built their processes specifically to avoid favoring one. The real myth to watch for is the idea that a concorded score guarantees equal treatment — it does in policy, but in practice admissions readers often look at subscores and test patterns in ways that concordance tables don't fully capture.
Why haven't the concordance tables been updated since 2018?
Building valid tables requires a large sample of students who took both tests in a comparable timeframe. The 2018 study relied on roughly 600,000 students from the class of 2017. The Enhanced ACT only launched in April 2025, so any new study needs multiple graduating classes of data before the sample size justifies publication. Updates are likely coming, but the timeline depends on how quickly that data accumulates.
What does concordance mean for NCAA athletic eligibility specifically?
The NCAA Eligibility Center uses the official concordance tables to convert submitted SAT or ACT scores into a common scale for its sliding-scale eligibility requirements. Division I and II recruits must meet minimum combinations of test score and GPA, and the concordance tables ensure a student submitting ACT scores is evaluated on the same standard as one submitting SAT scores. Check the current NCAA sliding scale directly, since the specific thresholds are updated periodically.